
Sea Level Data Tools
Transforming complex climate projections into intuitive, decision-ready tools used by practitioners, policymakers, and the public worldwide.
ROLE
Design lead (sole information architect and UI designer). Scoped each project, managed budgets and prioritized development.
SCOPE
Discovery · Practitioner interviews · Information architecture · Data visualization UX · Reusable UI patterns · Roadmap and budget prioritization · Engineering collaboration
PROBLEM
Turning a scientist's charts into tools for everyone else.
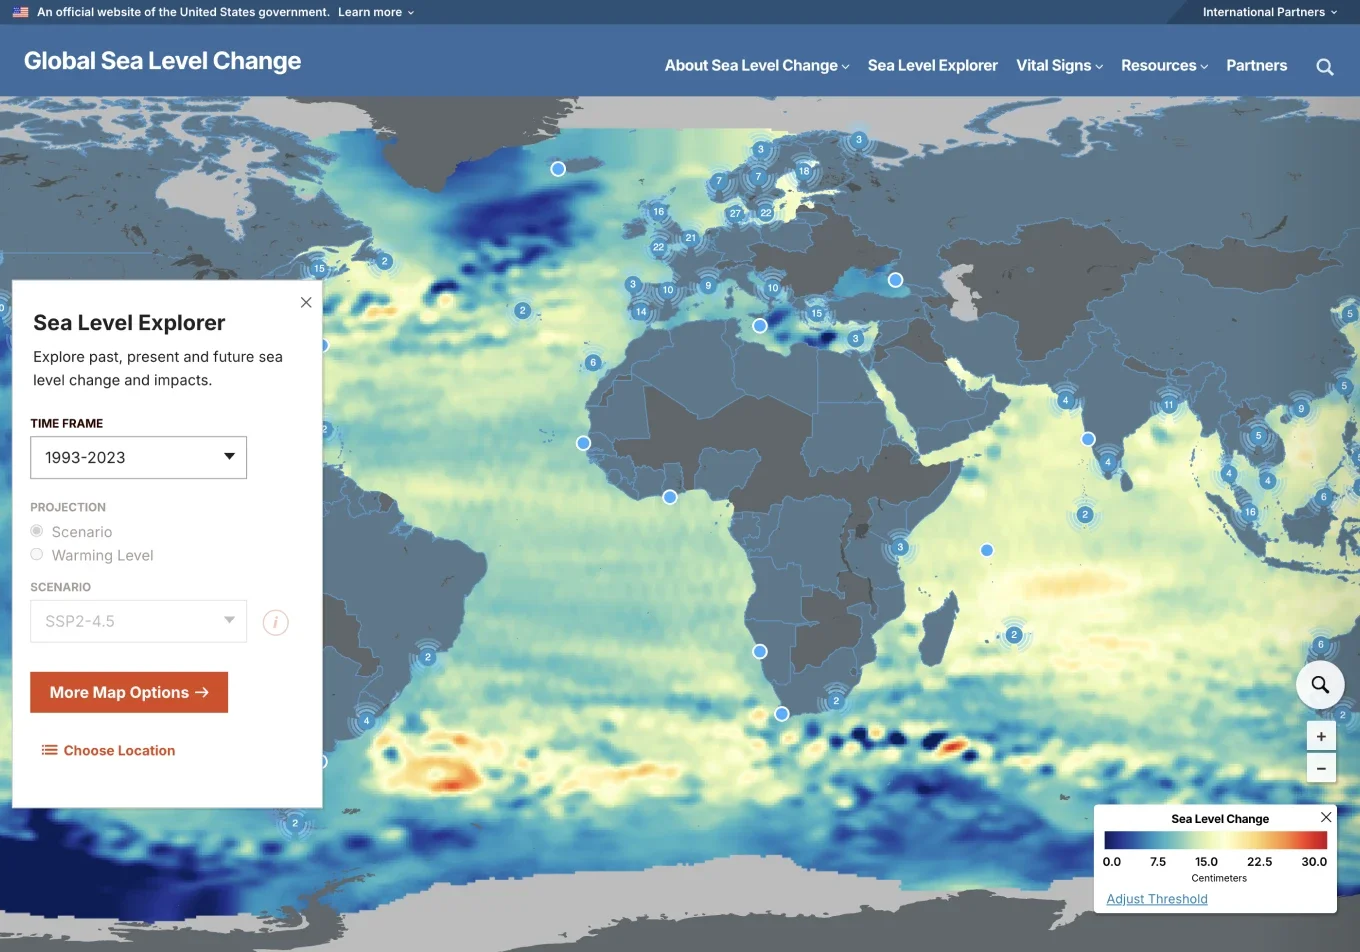
This started with a senior sea level scientist at JPL who wanted a tool visualizing how sea level has changed over time. In a short discovery meeting, he shared charts he'd made and a high-level idea of what he wanted. The data was strong, but the charts were hard to read if you weren't a scientist, and the audience ranged from journalists and congressional staffers to resilience officers, grant writers, engineers and the general public.
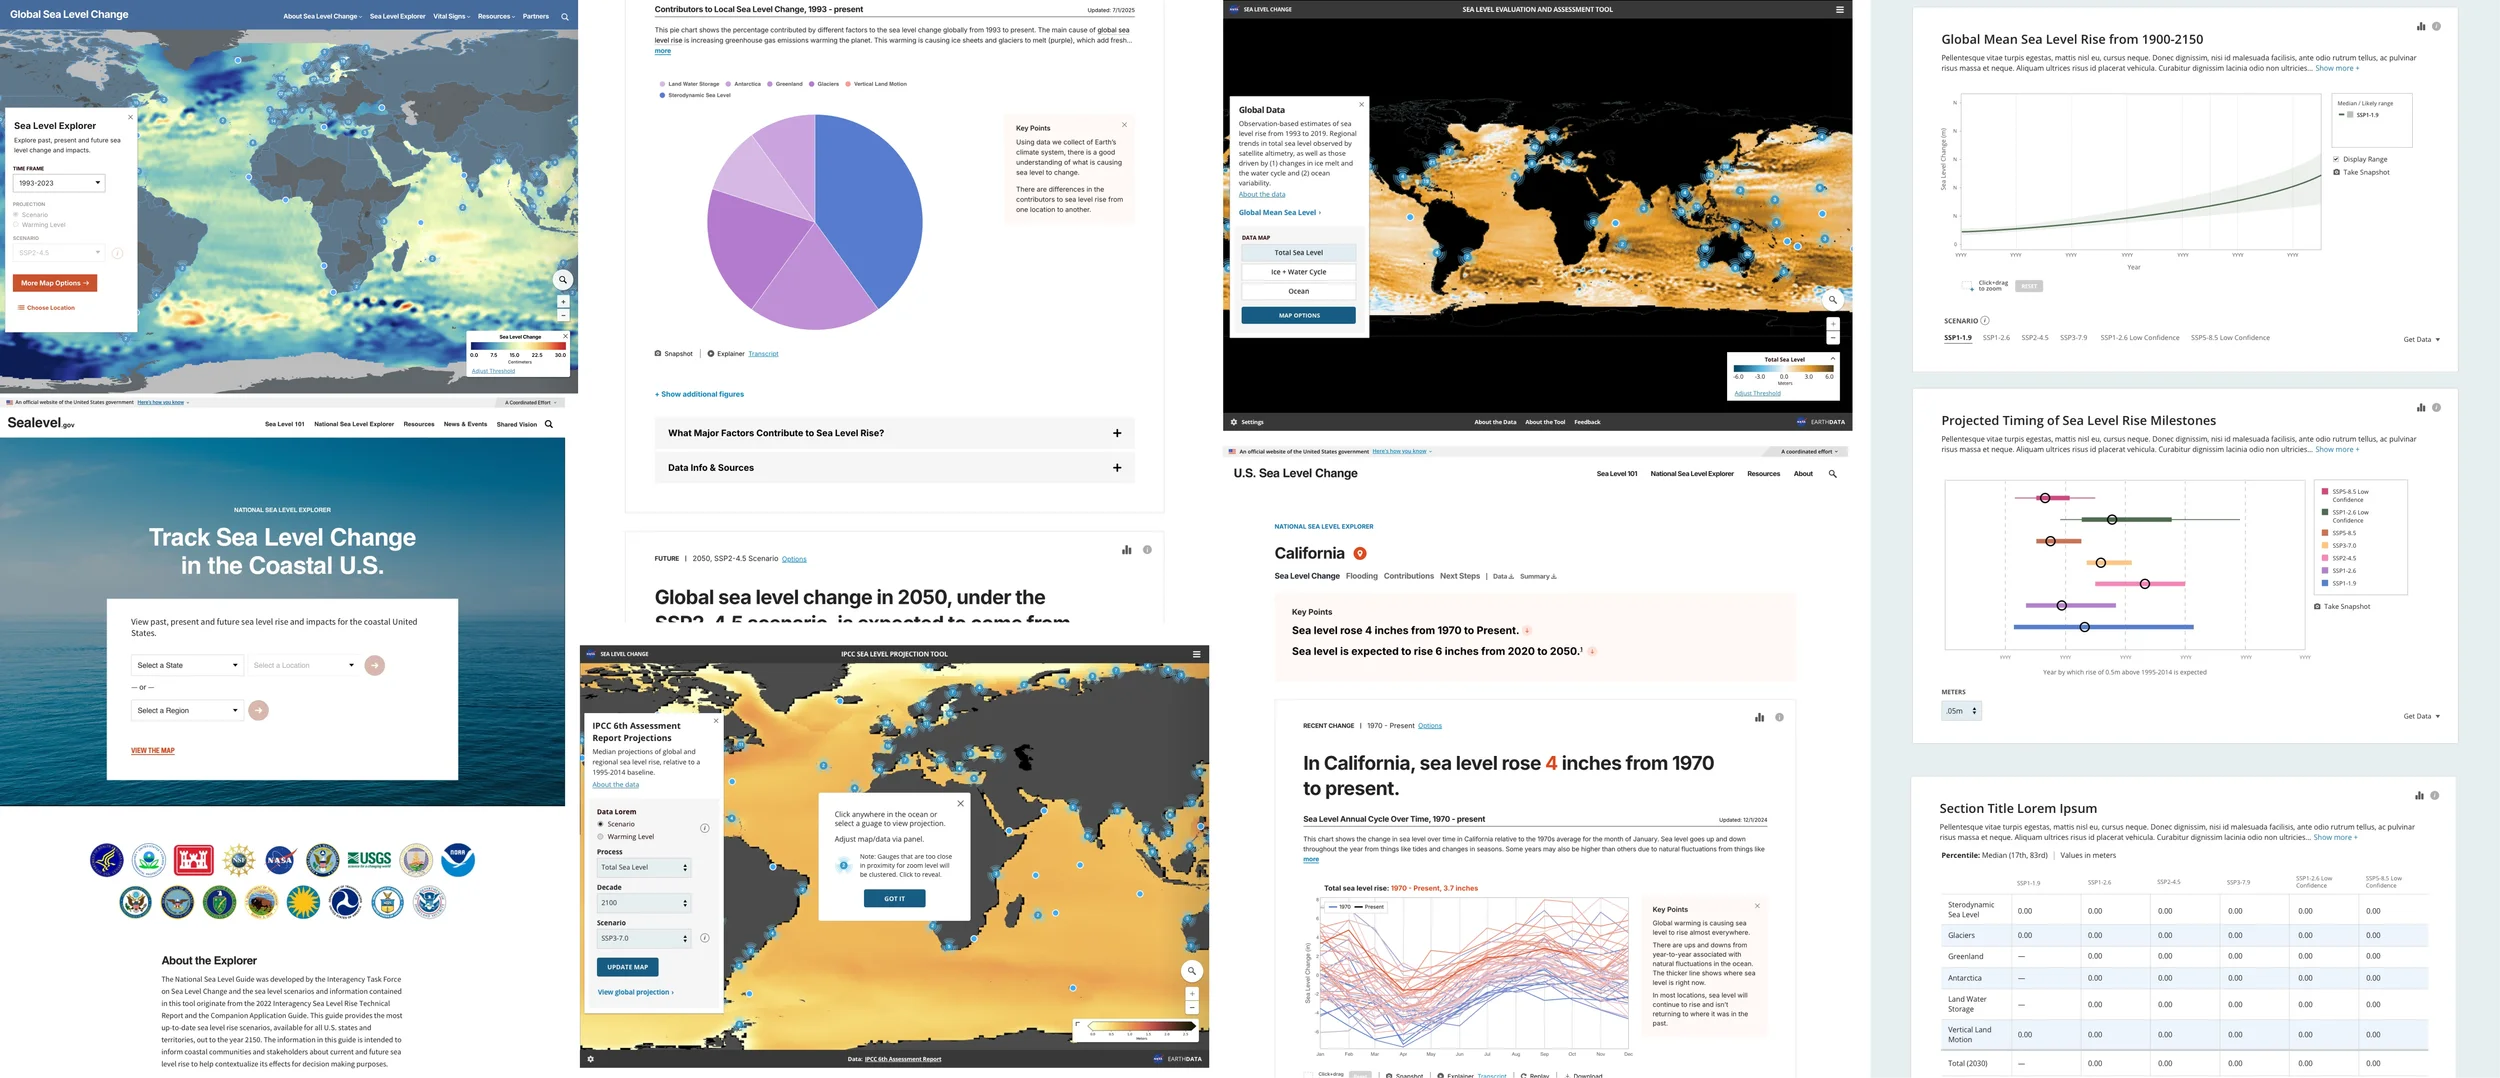
The first tool led to three more, each using different data or adding projections. Tools 3 and 4 told the full story of sea level rise: past to future, causes and impacts. We fielded feedback from practitioners, stakeholders and 45 graduate students in a university course. For tool 3, which focused on U.S. regions, I interviewed representatives from seven federal agencies, including NOAA, USGS and USACE. Each time, most of the notes were about language and context, which told me the structure was working.
KEY DECISION 1/3
Every location got its own page instead of an overlay on the map.
I had helped design several data tools for NASA, including Eyes on Exoplanets, where interactions opened overlays of more data within the same view. That approach can work, but I grew concerned it would confine the experience. So I designed a summary popover with a link to a full page of detail, opened by clicking the map. The detail page had room for the data story, worked better on phones and gave every location a link someone could share with a neighbor or a city council.
Subsequent tools needed more depth, so the detail page grew into a series of pages without a full redesign. One cost was losing your place on the map, and at first the browser back button didn't return people to it, so we fixed that and built it into every tool after.
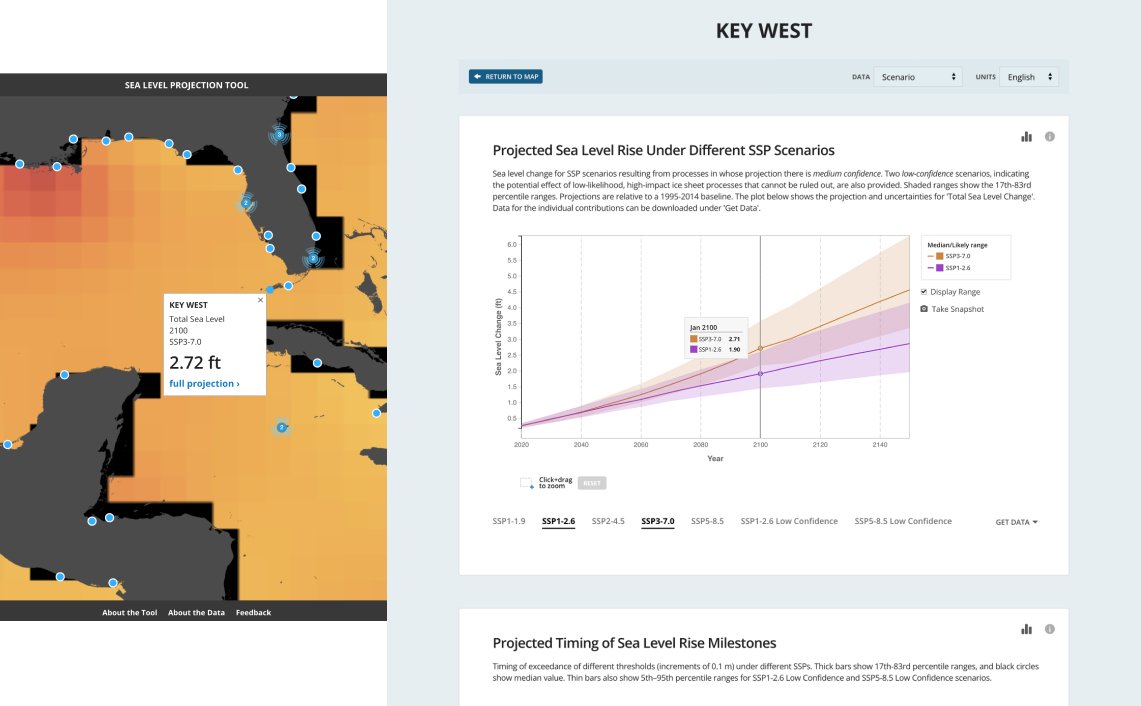
I avoided overlay-heavy interactions in favor of a structure that surfaced summaries from the map and flowed naturally into rich detail pages, supporting deeper context and long-term scalability.
KEY DECISION 2/3
Layers of explanation kept the story clear without losing users to tricky charts and technical terms.
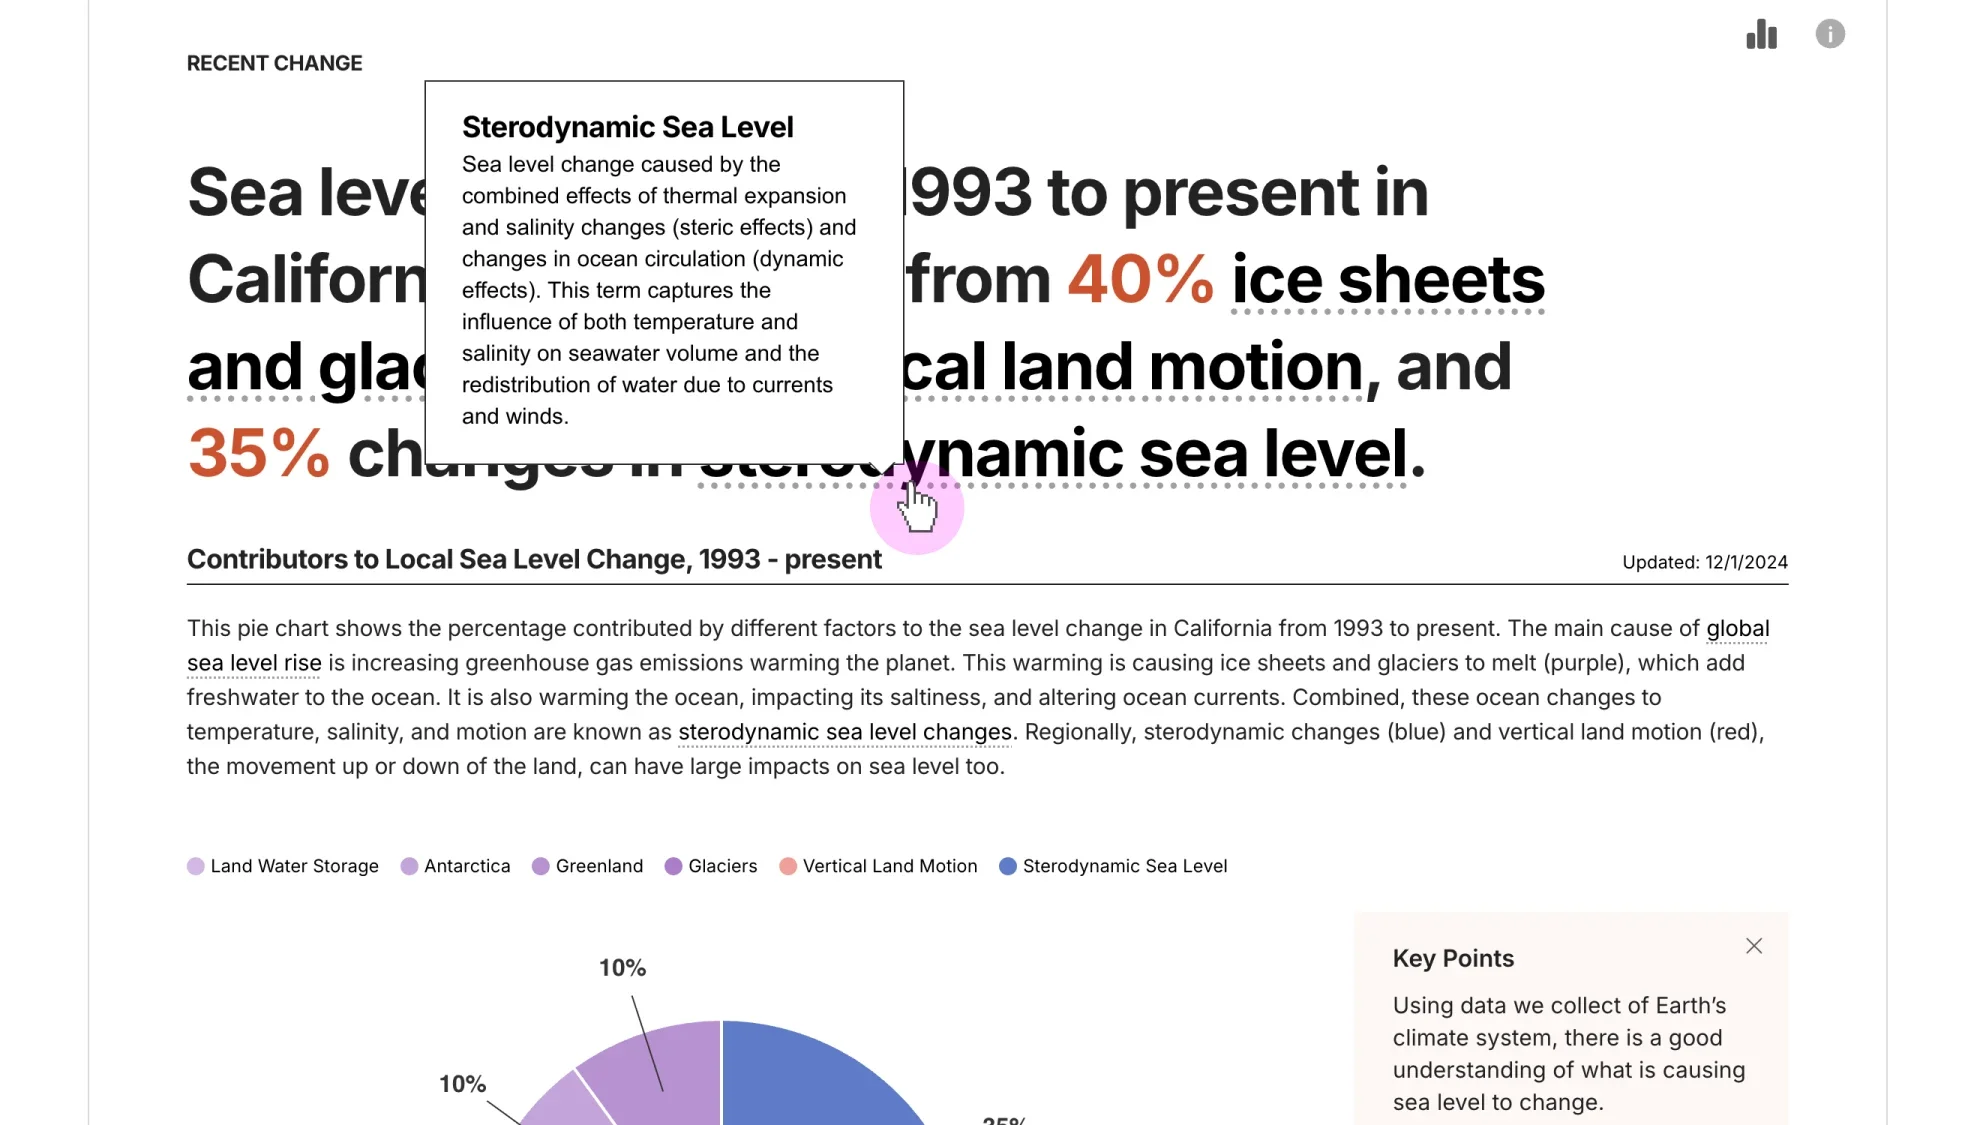
Scientists rely on terms like sterodynamic sea level and vertical land motion, and those terms matter to advanced users, but for most people they get in the way. That tension never fully went away, though we’ve made real progress. We worked with our lead scientist on consistent wording and designed layers of explanation: a plain-language headline with the key numbers, hover definitions for technical terms and a Key Points box that can be hidden to give the chart more room. When his chart intros grew long, I added a more/less toggle, and when he wanted audio explainers, I added them to the chart toolbar with a transcript window that can be dragged off the chart.
Scientific terms stayed in the headline, with a plain definition one hover away.
KEY DECISION 3/3
The tool and its explainer site work as one product.
The U.S. tool launched with a companion site that explains sea level rise in depth. Under each set of charts, I designed expandable panels (How We Measure, Data Info & Sources) with a short summary and a link to the matching Sea Level 101 section. Keeping explanations in one place keeps them consistent and the tool focused, even though curious users leave the data page to read more.
Each major planet and some key moons had a dashboard with live elements. Shown here is one of the planetary interactives with select hotspots and rotation.
OUTCOME
One scientist's charts became four tools on one framework.
The Sea Level Assessment Tool (2019) was followed by the IPCC Sea Level Projection Tool (2021), the U.S. Sea Level Explorer (2022) and the Global Sea Level Explorer (2023). The U.S. tool was built with input from practitioners at seven federal agencies, and the White House Office of Science and Technology Policy worked directly with our lead scientist on it. Each tool kept the same structure of a map, a page for every location and depth on demand, and added what its audience needed.
What’s new here is a tool that we are providing to the community, to distribute the latest climate knowledge produced by the IPCC and NASA scientists in an accessible and user-friendly way while maintaining scientific integrity.
Nadya Vinogradova Shiffer, program scientist and manager at NASA, who directs NASA’s Sea Level Change science team, speaking about the IPCC tool in a press release.
SSE's architecture became a foundation for science.nasa.gov.
AND NOW, THIS
In 2020, NASA began merging its outreach sites into science.nasa.gov, and its architects carried SSE's entity-based approach well beyond the solar system. I helped bring the templated navs over where they fit. Migrations usually cost search traffic, but most planets matched or beat their old SSE numbers.